- GraphQL
- load testing
- tutorial
How to Load Test a GraphQL API (Step-by-Step Guide)
Load testing a GraphQL API isn't the same as load testing a REST API, and treating it like one is how teams end up with green dashboards and angry users. Every GraphQL operation goes to the same endpoint, reads and writes often land in different parts of the stack, and field-level resolvers can hide cascading backend work that naïve tools never surface.
This guide walks through a complete GraphQL load test end-to-end: picking representative operations, handling auth, splitting query from mutation stats, interpreting percentiles, and finally wiring the test into CI so regressions fail the build.
We'll use Clobbr as the tool throughout because it auto-detects GraphQL and splits stats per operation, which turns what's usually a hand-rolled tooling exercise into "paste the query, run". You could do the same thing in k6 or Artillery with scripting. We touch on the tradeoffs toward the end.
What makes GraphQL load testing different
Four things flip the assumptions most load testing tools are built on:
- One URL, many operations. Every query, mutation, and subscription hits
the same
/graphqlendpoint. A tool that aggregates per-URL gives you a meaningless combined stat. - Reads and writes behave differently. Queries hit read caches, read-replicas, and DataLoader batches. Mutations hit primary databases, write-path validation, and downstream event buses. Averaging them hides whichever one is actually the problem.
- Field resolvers can cascade. A single query for a User with nested posts and comments might trigger dozens of backend calls. The dreaded N+1 problem is invisible from a pure HTTP perspective; you need per-operation timing to catch it.
- Auth is usually a short-lived token. JWT with a 5-minute TTL, signed request headers, or per-request session rotation. Static headers in your load tester will start failing with 401s mid-run.
Keep these in mind as we go. Every decision below traces back to one of them.
Step 1: Pick representative operations
You can't load test "GraphQL" as a single thing. You load test specific operations. Before touching the tool, answer three questions:
Which operations matter for real users? Pull the top 5–10 operation names from your production logs or observability platform by call volume. These are the ones whose p95 your users actually feel.
Which operations are known-heavy? The resolvers you already suspect: nested lists, aggregations, search queries with fuzzy matching, mutations that fire webhook chains. These deserve a dedicated load test even if they aren't high-volume.
What's the read/write split? Is your workload 90% queries and 10% mutations? Or 50/50? This affects both how you design the load test and how you interpret the results.
For this guide, we'll load test two representative operations:
- A
currentUserquery that fetches the signed-in user and their recent activity (read-heavy, cache-friendly). - A
createPostmutation that creates a new post and triggers a feed rebuild (write-heavy, cache-busting).
We'll load test them separately so the stats don't conflate.
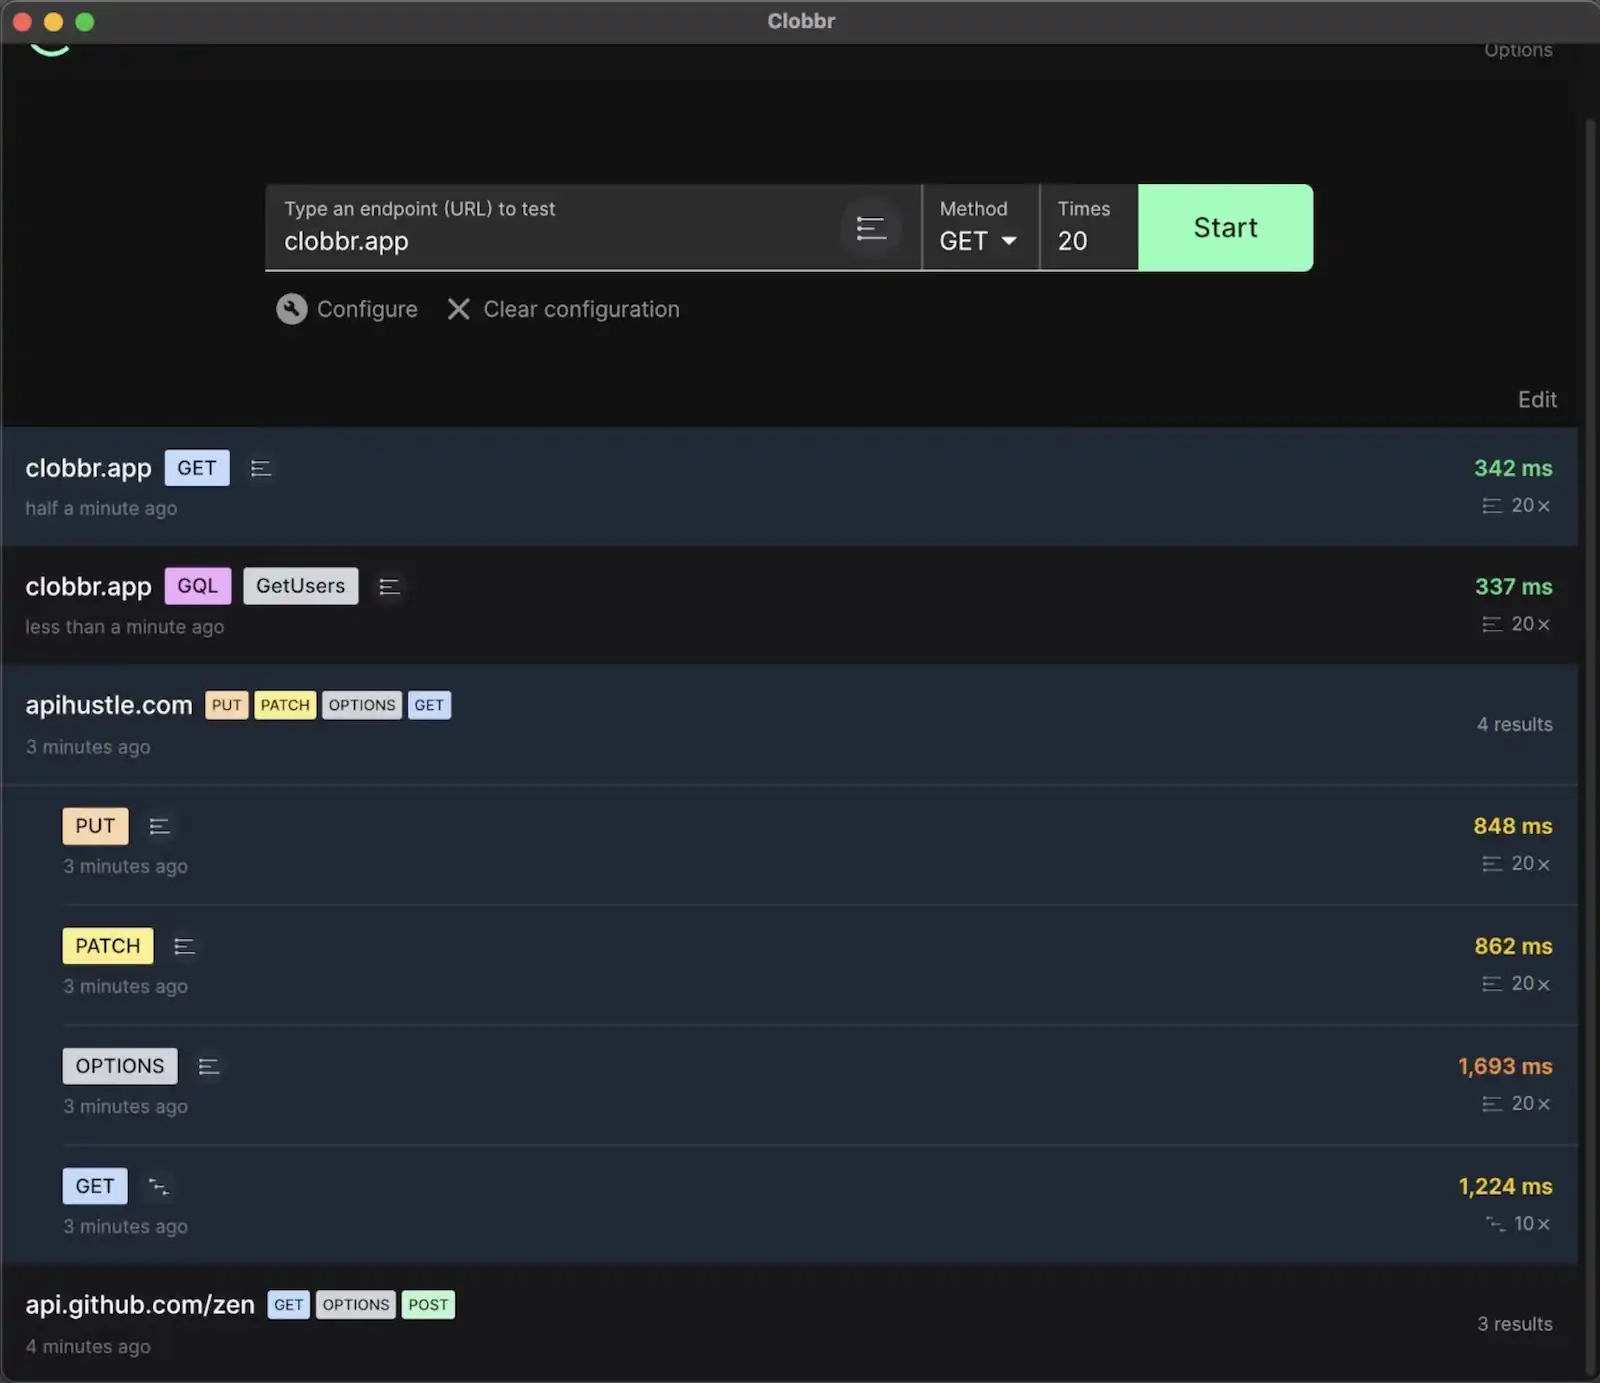
Step 2: Set up the test in Clobbr
Open Clobbr, click to create a new run, and fill in the basics.
For our currentUser query:
- URL:
https://api.example.com/graphql - Method:
POST(GraphQL over HTTP is POST by convention) - Content-Type:
application/json
Now the payload. Open the JSON payload editor and drop in the query:
{
  "operationName": "currentUser",
  "query": "query currentUser { me { id name recentActivity(limit: 20) { id type createdAt } } }",
  "variables": {}
}
Clobbr inspects the payload shape on save. Because it sees a query field
with the query { ... } keyword, it flags the run as GraphQL internally.
You'll see per-operation stats in the results view instead of a single
blended HTTP stat. There's no toggle or mode to pick; the detection is
automatic.
Step 3: Add authentication headers
Most real GraphQL APIs aren't anonymous. Clobbr has two modes for the
Authorization header:
Plain text. A static token, good for local testing against a staging environment where you've manually pasted a long-lived JWT:
Authorization: Bearer eyJhbGciOiJIUzI1NiIsInR5c...
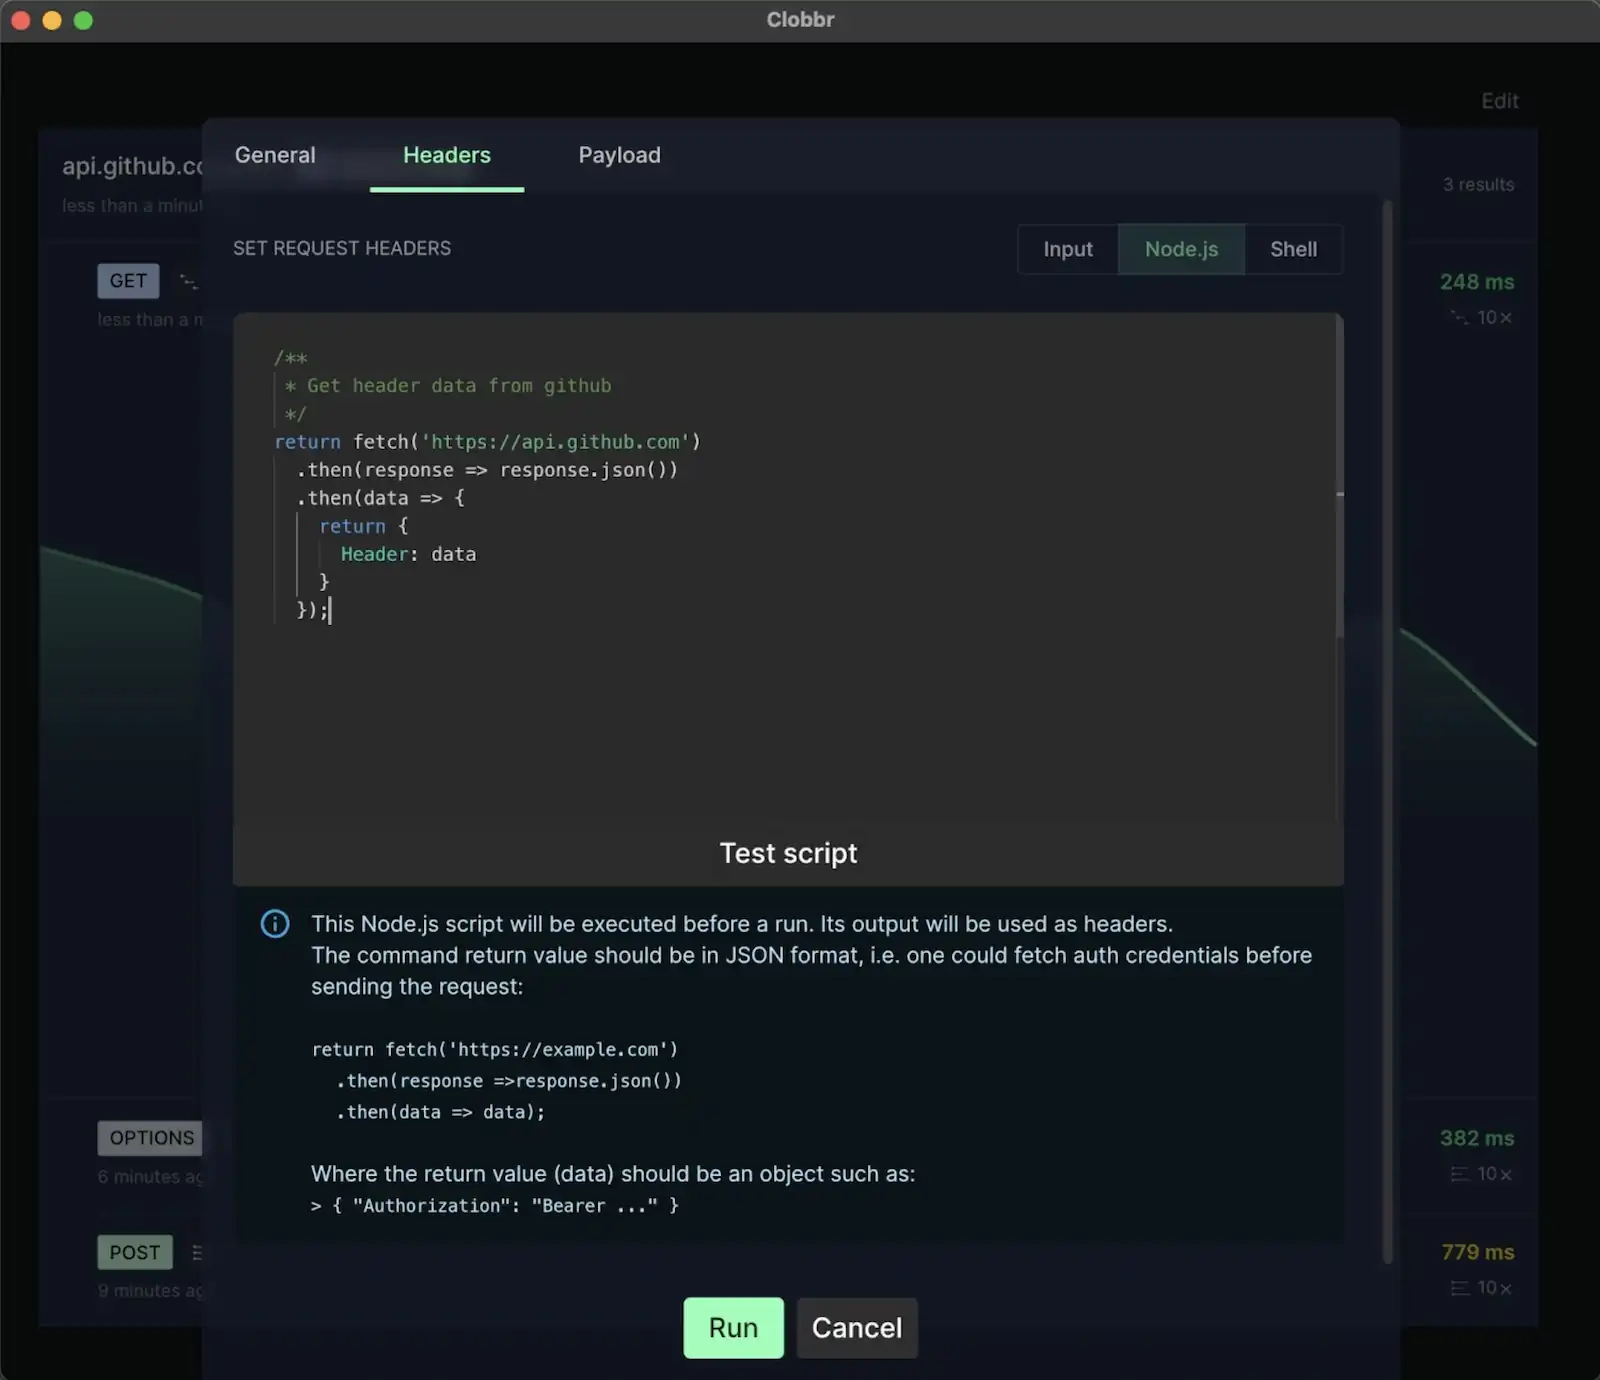
Scripted. A small inline script that runs before each iteration batch and computes the header. Use this when your tokens expire during the run, or when you need a signed header:
async function getHeaders() {
  const res = await fetch("https://auth.example.com/token", {
    method: "POST",
    headers: { "Content-Type": "application/json" },
    body: JSON.stringify({
      clientId: process.env.CLIENT_ID,
      clientSecret: process.env.CLIENT_SECRET,
    }),
  });
  const { access_token } = await res.json();
  return {
    Authorization: `Bearer ${access_token}`,
    "Content-Type": "application/json",
  };
}
Scripted headers run once per batch, so for a 1000-iteration test with batches of 50 you'll request a fresh token 20 times. No 401s mid-run.
Step 4: Run queries and mutations separately
Set iterations to 500 and start with sequential mode. Sequential means each request waits for the previous one to finish, which gives you clean latency stats: you're measuring the endpoint's inherent response time without concurrency noise.
Run the currentUser test, save the results.
Now duplicate the run and change the payload to the mutation:
{
  "operationName": "createPost",
  "query": "mutation createPost($input: CreatePostInput!) { createPost(input: $input) { id title createdAt } }",
  "variables": {
    "input": {
      "title": "Load test post",
      "body": "Lorem ipsum dolor sit amet.",
      "tags": ["test"]
    }
  }
}
Run the same 500 iterations, sequential.
You now have baseline latency for each operation. Don't skip this step; without a clean baseline, it's hard to say whether a concurrent result is "slow because of the endpoint" or "slow because of concurrency".
Step 5: Re-run in parallel mode
Now switch to parallel mode (10 concurrent, 500 total iterations) and re-run each operation. This tests how your service handles concurrency: connection pool saturation, mutex contention, database row locking, cache stampedes.
Compare sequential vs parallel results:
- p50 stays similar: your service scales fine at this level.
- p50 creeps up: there's mild contention somewhere, likely a connection pool, thread pool, or a shared resource.
- p50 doubles or more: you have a serious concurrency bottleneck. The service is effectively serializing work that should be parallel.
- p95 explodes while p50 stays low: a small subset of requests is getting stuck. Usually a lock, a slow upstream call, or a background process on the server.
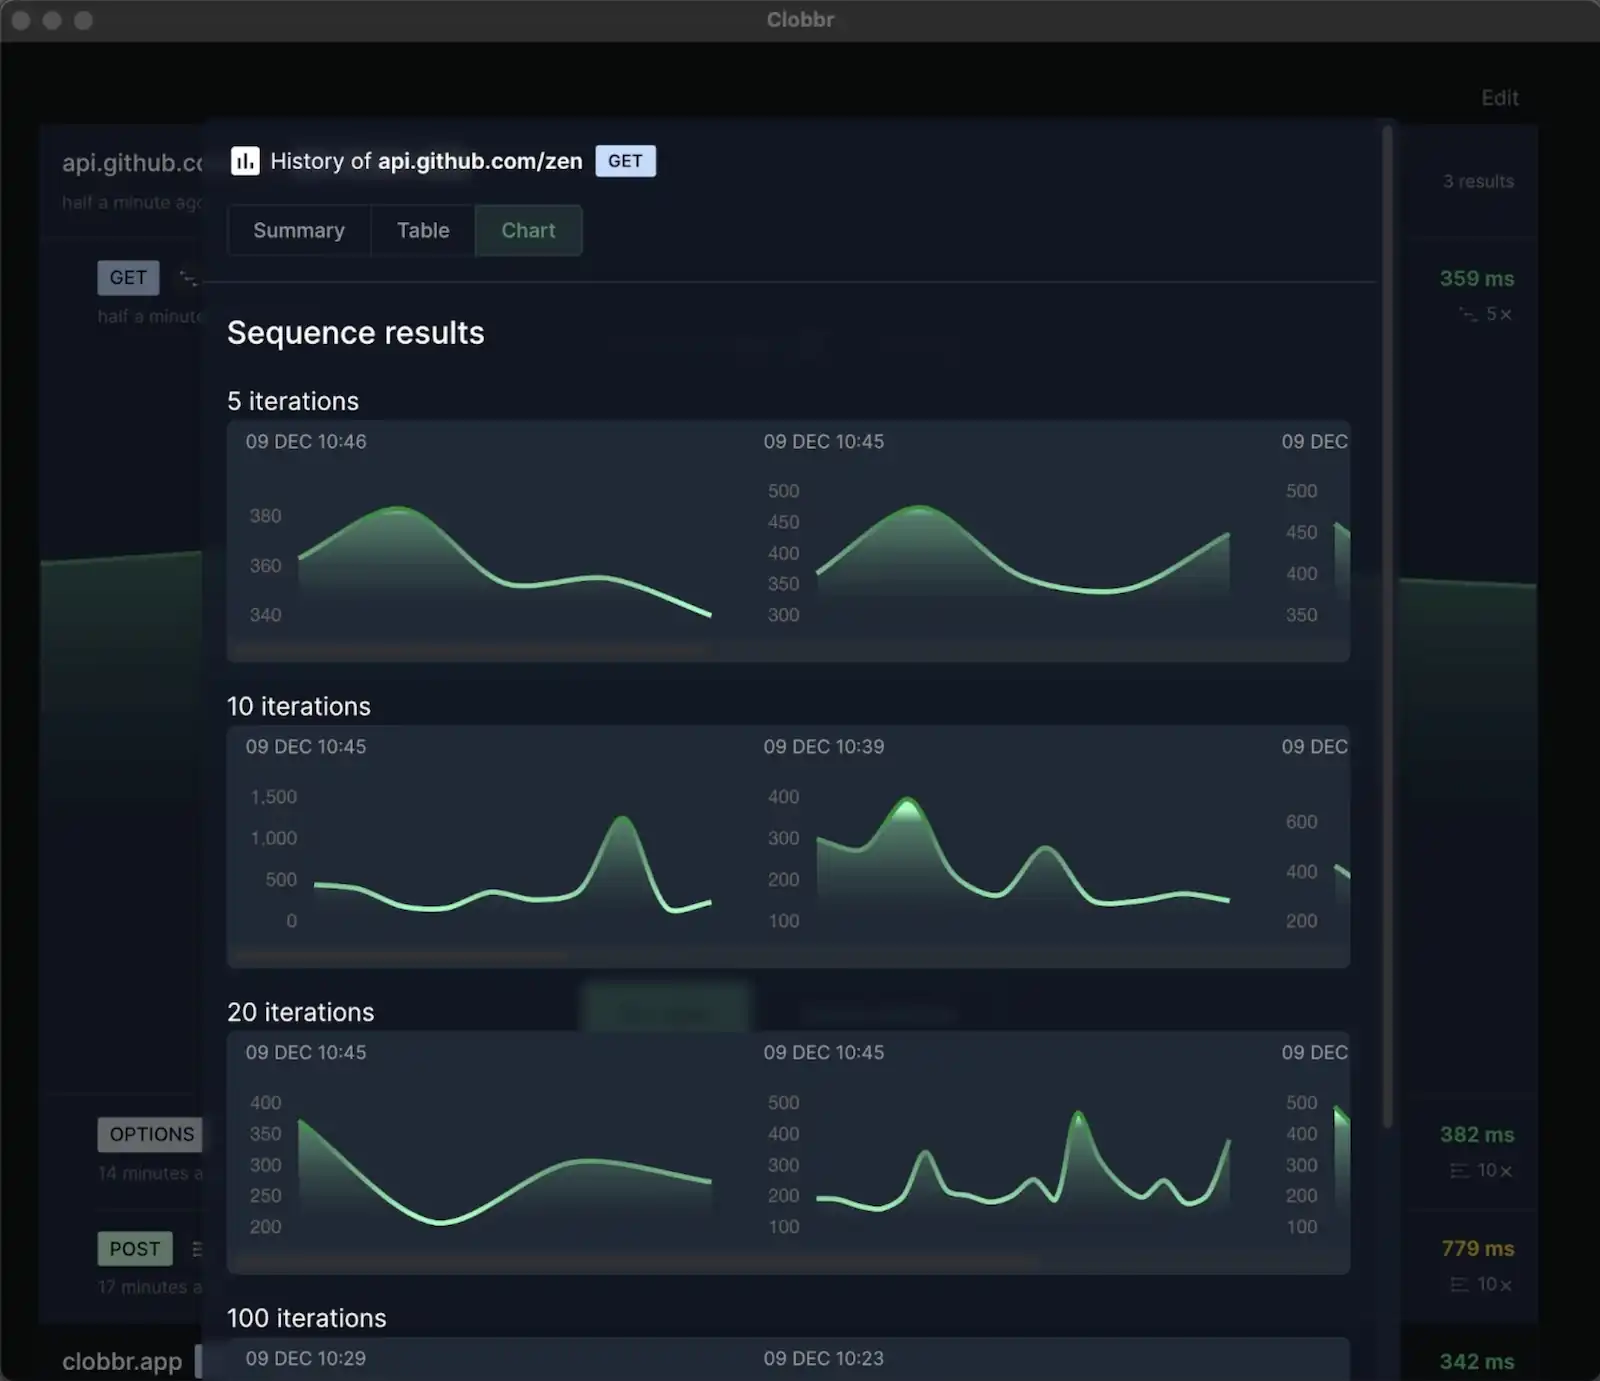
Clobbr keeps both runs in history so you can flip between them and compare charts directly.
Step 6: Interpret p95 / p99 by operation
Per-operation stats are where the real signal lives. A few patterns we see over and over:
Query p50 low, p95 spikes. One or more field resolvers is triggering an
unbatched database call under load. Check DataLoader usage, missing
@defer or @stream directives if you use them, and any resolvers that
fetch a list of parent IDs and then loop fetching children.
Mutation p50 higher than query p50. Normal. Writes hit the primary database, write-path validation, and often fire events or webhooks.
Mutation p95 much higher than query p95. Lock contention. Two mutations are fighting for the same row, or the same table-level lock. Ramp concurrency up in Clobbr; if p95 grows faster than linear with concurrency, it's almost certainly lock contention.
Parallel run fails where sequential passed. Concurrency bottleneck. Connection pool size, HTTP server worker count, database connection limit. Look at your server's logs during the run; most modern servers log when they're turning away connections.
If you want a deeper dive on what these percentiles actually mean and how to act on them, we have a full percentiles explainer.
Step 7: Wire the test into CI
Once a test in the GUI tells you something useful, promote it to CI so it
tells you that every time something changes. Clobbr's GUI config translates
directly to @clobbr/cli.
A minimal GitHub Actions workflow:
name: graphql-load-test
on:
  pull_request:
  push:
    branches: [main]

jobs:
  load-test:
    runs-on: ubuntu-latest
    steps:
      - uses: actions/checkout@v4
      - uses: actions/setup-node@v4
        with:
          node-version: 20

      - name: Install Clobbr CLI
        run: npm install -g @clobbr/cli

      - name: Load test currentUser query
        env:
          API_URL: ${{ secrets.STAGING_API_URL }}
          API_TOKEN: ${{ secrets.STAGING_API_TOKEN }}
        run: |
          clobbr \
            --url "$API_URL/graphql" \
            --method POST \
            --iterations 200 \
            --parallel \
            --headers "Authorization: Bearer $API_TOKEN" \
            --headers "Content-Type: application/json" \
            --payload-file ./.ci/current-user-query.json \
            --success-rate 99 \
            --output json > current-user-results.json

      - name: Load test createPost mutation
        env:
          API_URL: ${{ secrets.STAGING_API_URL }}
          API_TOKEN: ${{ secrets.STAGING_API_TOKEN }}
        run: |
          clobbr \
            --url "$API_URL/graphql" \
            --method POST \
            --iterations 100 \
            --parallel \
            --headers "Authorization: Bearer $API_TOKEN" \
            --headers "Content-Type: application/json" \
            --payload-file ./.ci/create-post-mutation.json \
            --success-rate 99 \
            --output json > create-post-results.json

      - name: Upload results
        if: always()
        uses: actions/upload-artifact@v4
        with:
          name: graphql-load-test-results
          path: "*-results.json"
The CLI fails the step when success rate drops below 99%, and uploads the
JSON output as an artifact you can diff against a previous run. For stricter
gates, add a follow-up step that parses p95 with jq and exits non-zero if
it's over your budget. We have a full CI/CD guide
walking through that.
Common pitfalls
A few things we see teams do that quietly invalidate their results:
- Running against localhost. No network, no real database, no real serialization cost. The numbers are comforting and useless. Always test against staging.
- Using the same test user for every request. If your mutation creates rows, reusing the same user generates hot-path contention that isn't representative. Rotate identities in scripted payloads.
- Testing under cache warmup. Run a small warmup batch before the measured run, then reset measurement. Otherwise the first 10% of requests skew your p50.
- Ignoring the client side. If your frontend batches operations with a single network request, load test the batched shape, not individual operations.
- Treating subscriptions like queries. Subscriptions hold open long-lived connections. HTTP load testing tools (Clobbr included) aren't the right fit. Use a WebSocket-aware tool for those.
Could you do this in k6 or Artillery?
Yes, with scripting. Both tools would have you write a JavaScript test file that POSTs a JSON body, parses the response, and splits stats per operation in your own code. It's not difficult, but it's a solid hour of tooling work per operation, and every time the query changes, you touch the script. Clobbr's GraphQL detection saves that hour by treating per-operation stats as a first-class concept.
For a broader view of the tradeoffs, see our Clobbr vs k6 comparison or the full GraphQL use case page.
Wrapping up
A useful GraphQL load test is specific, per-operation, and repeatable. The workflow above (pick operations, test sequential, test parallel, interpret per-operation percentiles, ship to CI) takes about an afternoon the first time and minutes every time after that.
If you want to try it on your own API, Clobbr's free on npm
(npm install -g @clobbr/cli) and the desktop app ships as a lifetime
license on Mac or Windows. No account, no cloud, no subscription, and the
first test takes under a minute.